Bestand:Co2-temperature-records.svg
Naar navigatie springen
Naar zoeken springen


Afmetingen van deze voorvertoning van het type PNG van dit SVG-bestand: 720 × 540 pixels Andere resoluties: 320 × 240 pixels | 640 × 480 pixels | 800 × 600 pixels | 1.024 × 768 pixels | 1.280 × 960 pixels.
Afbeelding in hogere resolutie (SVG-bestand, nominaal 720 × 540 pixels, bestandsgrootte: 225 kB)
Beschrijving
| Beschrijving |
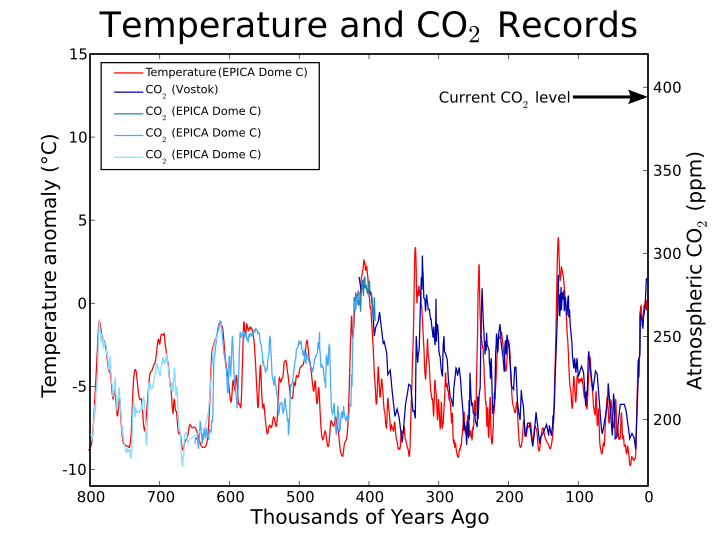
English: This figure shows historical carbon dioxide (right axis) and reconstructed temperature (as a difference from the mean temperature for the last 100 years) records based on Antarctic ice cores, providing data for the last 800,000 years.
This figure was produced by Leland McInnes using python and matplotlib and is licensed under the GFDL. All data is from publicly available sources.
|
| Datum | |
| Bron | Eigen werk (Own work) |
| Auteur | Leland_McInnes (talk) (Uploads) |
| Andere versies |
|
.png)
![CO2 at Mauna Loa since 1958. [1] [2]](http://commons.wikimedia.org/wiki/File:Co2maunaloa2003.png)

![]] and greenhouse gases during 420,000 years.](http://commons.wikimedia.org/wiki/File:Vostok_420ky_4curves_insolation.jpg)


Source code
The image was created with the following script, making use of the matplotlib library.
# -*- coding: utf-8 -*-
import numpy as np
import matplotlib.pylab as plt
from matplotlib.font_manager import FontProperties
def smooth(signal, window_size):
extended_signal = signal[window_size:0:-1] + signal + signal[-1:-window_size:-1]
s = np.array(extended_signal)
w = np.hamming(window_size)
y = np.convolve(w/w.sum(), s, mode="same")
return y[window_size:-window_size+1]

temp_file = open("EDC_dD_temp_estim.csv")
data_rows = [x.split() for x in temp_file if not x.startswith("#") and len(x.split()) == 5]
temp_years = [float(x[1]) for x in data_rows]
raw_temp_vals = [float(x[3]) for x in data_rows]
temp_vals = list(smooth(raw_temp_vals[:4000], 50)) + list(smooth(raw_temp_vals[4000:6000], 10)) + raw_temp_vals[6000:]
co2_file1 = open("Vostok_CH4_CO2_age.csv")
data_rows = [x.split("\t") for x in co2_file1 if not x.startswith('"')]
co2_years1 = [float(x[0]) for x in data_rows if x[2] != "\n"]
co2_vals1 = [float(x[2].strip()) for x in data_rows if x[2] != "\n"]
co2_file2 = open("EDC_CO2_423-391_kyr_BP.csv")
data_rows = [x.split() for x in co2_file2 if not x.startswith('"')]
co2_years2 = [float(x[1]) for x in data_rows]
co2_vals2 = [float(x[2]) for x in data_rows]
co2_file3 = open("EDC_CO2_650-413_kyr_BP.csv")
data_rows = [x.split() for x in co2_file3 if not x.startswith('"')]
co2_years3 = [float(x[1]) for x in data_rows]
co2_vals3 = [float(x[2]) for x in data_rows]
co2_file4 = open("EDC99_CO2_bern.csv")
data_rows = [x.split() for x in co2_file4 if x.startswith("3")]
co2_years4 = [float(x[1]) for x in data_rows]
co2_vals4 = [float(x[2]) for x in data_rows]
plt.title("Temperature and CO$_2$ Records", size=28)
temp_ax = plt.axes()
temp_ax.yaxis.tick_left()
tline = plt.plot(temp_years, temp_vals, "red")
plt.ylabel(u"Temperature anomaly (°C)", size=16)
plt.xlabel("Thousands of Years Ago", size=16)
plt.xlim(800,0)
plt.ylim(-11,15)
co2_ax = plt.axes([0.125,0.1,0.775,0.8], frameon=False)
co2_ax.yaxis.tick_right()
co2_ax.yaxis.set_label_position("right")
plt.xticks([])
cline1 = plt.plot(co2_years1, co2_vals1, "#0000AA")
cline2 = plt.plot(co2_years2, co2_vals2, "#2288AA")
cline3 = plt.plot(co2_years3, co2_vals3, "#44AAFF")
cline4 = plt.plot(co2_years4, co2_vals4, "#88DDFF")
plt.ylabel("Atmospheric CO$_2$ (ppm)", size=16)
plt.xlim(800,0)
plt.ylim(160,420)
plt.annotate("Current CO$_2$ level", (2,386.36), (300,386.36), xycoords="data", arrowprops=dict(arrowstyle="->"))
plt.legend((tline, cline1, cline2, cline3, cline4), ("Temperature (EPICA Dome C)", "CO$_2$ (Vostok)", "CO$_2$ (EPICA Dome C)", "CO$_2$ (EPICA Dome C)", "CO$_2$ (EPICA Dome C)"), "upper left", prop=FontProperties(size=9), pad=0.1, handletextsep=0.005)
plt.savefig("py-co2-temp.svg")
plt.show()
Licentie
Leland McInnes uit en.wikipedia.org, de auteursrechthebbende van dit werk, maakt het hierbij onder de volgende licentie beschikbaar:
| Dit bestand is gelicenseerd onder de Creative Commons-licentie Naamsvermelding-Gelijk delen 3.0 Unported Onderhevig aan disclaimers. | ||
| Naamsvermelding: Leland McInnes uit en.wikipedia.org | ||
| ||
| Deze licentietag is toegevoegd aan dit bestand in verband met de GFDL licentie-update. |

|
Toestemming wordt verleend voor het kopiëren, verspreiden en/of wijzigen van dit document onder de voorwaarden van de GNU-licentie voor vrije documentatie, versie 1.2 of enige latere versie als gepubliceerd door de Free Software Foundation; zonder Invariant Sections, zonder Front-Cover Texts, en zonder Back-Cover Texts. Een kopie van de licentie is opgenomen in de sectie GNU-licentie voor vrije documentatie. Onderhevig aan disclaimers. |
Oorspronkelijk uploadlogboek
De oorspronkelijke beschrijving van deze afbeelding stond hier. Alle volgende gebruikersnamen verwijzen naar en.wikipedia.
| Datum/tijd | Afmetingen | Gebruiker | Opmerking |
|---|---|---|---|
| 2009-01-11 20:50 | 720×540× (230122 bytes) | Leland McInnes | |
| 2007-01-14 00:29 | 1052×744× (40671 bytes) | Leland McInnes | (reverse direction of time scale) |
| 2006-11-04 17:22 | 1052×744× (40730 bytes) | Leland McInnes | |
| 2006-11-04 04:07 | 1052×744× (42937 bytes) | Leland McInnes | |
| 2006-11-04 04:03 | 1052×744× (42931 bytes) | Leland McInnes | One last try at entering the title |
| 2006-11-04 03:56 | 1052×744× (39678 bytes) | Leland McInnes | |
| 2006-11-04 01:04 | 1052×744× (40314 bytes) | Leland McInnes | |
| 2006-11-04 01:02 | 1052×744× (40272 bytes) | Leland McInnes | This figure shows apparent correlations between historical CO2 and temperature records based on Antarctic ice cores, providing data for the last 650,000 years. Note that deuterium levels differ between Vostok and EPICA ice cores and are therefore plotted |
Deze niet W3C-verklaarde vectorafbeelding is gemaakt met Matplotlib.
Bestandsgeschiedenis
Klik op een datum/tijd om het bestand te zien zoals het destijds was.
| Datum/tijd | Miniatuur | Afmetingen | Gebruiker | Opmerking | |
|---|---|---|---|---|---|
| huidige versie | 6 sep 2015 07:21 | | 720 × 540 (225 kB) | OgreBot | (BOT): Reverting to most recent version before archival |
Bestandsgebruik
Dit bestand wordt op de volgende pagina gebruikt: