Bestand:Population curve.svg
Naar navigatie springen
Naar zoeken springen


Afmetingen van deze voorvertoning van het type PNG van dit SVG-bestand: 547 × 332 pixels Andere resoluties: 320 × 194 pixels | 640 × 388 pixels | 800 × 486 pixels | 1.024 × 622 pixels | 1.280 × 777 pixels.
Afbeelding in hogere resolutie (SVG-bestand, nominaal 547 × 332 pixels, bestandsgrootte: 10 kB)
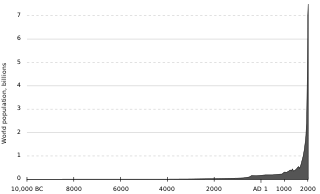
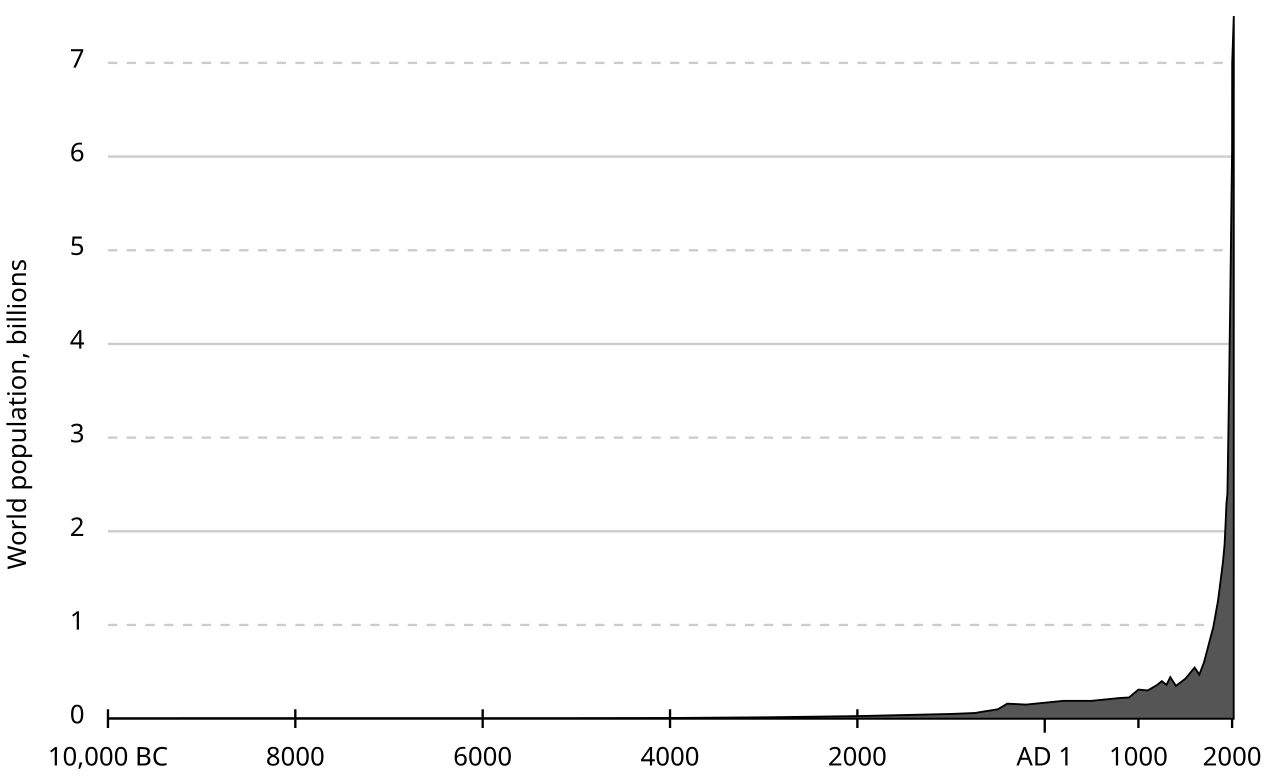
| Beschrijving | World human population (est.) 10,000 BC–2000 AD. |
| Bron | originally uploaded to en.wikipedia as Population curve.svg. The data is from the "lower" estimates at census.gov (archive.org mirror). |
| Auteur | El T |
| Andere versies | File:Population curve-ar.svg |
| Dit werk vrijgegeven in het publieke domein door de auteur, El T op de Engelstalige Wikipedia. Dit is wereldwijd van toepassing. In sommige landen is dit wettelijk niet mogelijk; in die gevallen geldt: El T staat iedereen toe dit werk voor eender welk doel te gebruiken, zonder enige voorwaarden, tenzij zulke voorwaarden door de wet worden voorgeschreven. |
Data
year   world population (millions)
-10000 4
-8000  5
-7000  5
-6000  5
-5000  5
-4000  7
-3000  14
-2000  27
-1000  50
-750   60
-500   100
-400   160
-200   150
1      170
200    190
400    190
500    190
600    200
700    210
800    220
900    226
1000   310
1100   301
1200   360
1250   400
1300   360
1340   443
1400   350
1500   425
1600   545
1650   470
1700   600
1750   790
1800   980
1850   1260
1900   1650
1910   1750
1920   1860
1930   2070
1940   2300
1950   2400
1960   3020
1970   3700
1974   4000
1980   4430
1987   5000
1990   5260
2000   6070
2000   6500 (July 2)*
2000   6747.5 (October 2)*
2001   7000 (March 15)*
2001   7000.025 (April 21)*

*) Data points as actually plotted in 2012-05-24 revision
   (exact X axis values are 2000.5, 2000.75, 2001.2 and 2001.3)
   These are probably incorrect.
Sources
- Biraben, Jean-Noel, 1980, An Essay Concerning Mankind's Evolution, Population, Selected Papers, December, table 2.
- Durand, John D., 1974, "Historical Estimates of World Population: An Evaluation," University of Pennsylvania, Population Center, Analytical and Technical Reports, Number 10, table 2.
- Haub, Carl, 1995, "How Many People Have Ever Lived on Earth?" Population Today, February, p. 5.
- McEvedy, Colin and Richard Jones, 1978, "Atlas of World Population History," Facts on File, New York, pp. 342-351.
- Thomlinson, Ralph, 1975, "Demographic Problems, Controversy Over Population Control," Second Edition, Table 1.
- United Nations (UN), 1973, The Determinants and Consequences ofPopulation Trends, Population Studies, No. 50., p.10.
- United Nations, 1999, The World at Six Billion, Table 1, "World Population From" Year 0 to Stabilization, p. 5, http://www.un.org/esa/population/publications/sixbillion/sixbilpart1.pdf
- U.S. Census Bureau (USCB), 2008, "Total Midyear Population for the World: 1950-2050", Data updated 12-15-2008, https://www.census.gov\/ipc/www/idb/worldpop.html
Bestandsgeschiedenis
Klik op een datum/tijd om het bestand te zien zoals het destijds was.
| Datum/tijd | Miniatuur | Afmetingen | Gebruiker | Opmerking | |
|---|---|---|---|---|---|
| huidige versie | 16 aug 2017 00:24 | | 547 × 332 (10 kB) | Gregor Hagedorn | Updating to 2017/7.5 billion |
Bestandsgebruik
Dit bestand wordt op de volgende pagina gebruikt: